
Buying a used electric car: why the odometer reading alone says nothing about the battery (Kopie)
A used electric car with 31,069 miles (50,000 km) on the odometer sits at a dealership. Its price depends on the actual battery state, a figure nobody can see. Even at this mileage, two identical vehicles can differ by up to ten percentage points in State of Health and still look exactly the same. Anyone wanting to check the battery state of a used electric car therefore needs more than just the odometer reading.
This is exactly what the new AVILOO Certified EV Battery Report reveals for 20 of the world's best-selling electric cars: more than 500,000 independent AVILOO FLASH Test results for used electric cars from 2022 to 2026. The report will now be published twice a year, drawing on AVILOO's global diagnostics database, which holds more than 1 million independent tests. AVILOO Certified electric cars are used vehicles whose actual battery state has been documented using the AVILOO FLASH Test.
Key takeaways
- More than 500,000 AVILOO FLASH Test results analysed from 2022 to 2026, covering 20 electric car models
- Data from North and South America, Europe, Australia and Asia
- State of Health (SoH), the share of original capacity a battery still retains, can vary by up to 16.4 percentage points between the best and weakest examples of the same model
- Smaller batteries with more frequent charging cycles age faster on average. Across all three mileage levels analysed, the Nissan Leaf ZE1 has the lowest SoH of the four models examined in detail.
Why an average per model is not enough
Battery health varies within each of the 20 models tested, between models and, above all, between individual vehicles of the same model. An average per model therefore says little about a specific car.
Only the AVILOO FLASH Test assesses an individual vehicle. The report provides the benchmark needed to put a test result into context. Anyone who knows that SoH at 31,069 miles (50,000 km) can range from around 85 to 99 percent depending on the model understands what a single FLASH Test result means. This shows how great the uncertainty would be without a test and why an independent test is needed in the first place. The report also reveals model-level patterns, such as battery size or climate impact, that are relevant for fleet decisions and residual value calculations, even without assessing an individual vehicle.
How the report works
The report is based on the independent AVILOO FLASH Test, a three-minute diagnostic procedure via the vehicle's OBD port. For each model, at three mileage milestones (31,069, 62,137 and 93,206 miles, i.e. 50,000, 100,000 and 150,000 km), AVILOO identifies the SoH range covering 99 percent of all independently tested vehicles of that model. The median serves as the reference point in each case.
Crucially, the FLASH Test does not simply read the value reported by the vehicle's on-board battery management system. Instead, AVILOO independently calculates SoH using a statistical model trained on hundreds of thousands of comparable used vehicles, factoring in mileage, age, cycle count, cell voltage spread, energy counters and other diagnostic signals.
When a model is offered with several battery sizes, the report groups the variants under a single model name. Part of the resulting range therefore reflects these different battery sizes, not just individual ageing.
The spread grows with every kilometre driven
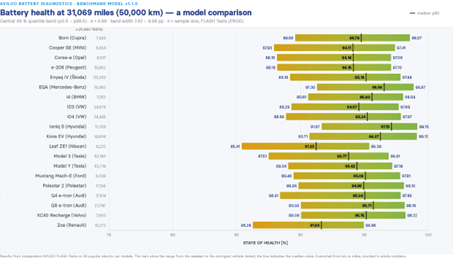
The spread across the 20 models tested is already apparent at 31,069 miles (50,000 km): the median ranges from 91.2 percent for the Nissan Leaf ZE1 to 97.1 percent for the Hyundai Ioniq 5. Within individual models, the spread is between 7.4 and 10.0 percentage points. The Nissan Leaf ZE1 shows the widest range, from 85.4 to 95.4 percent.
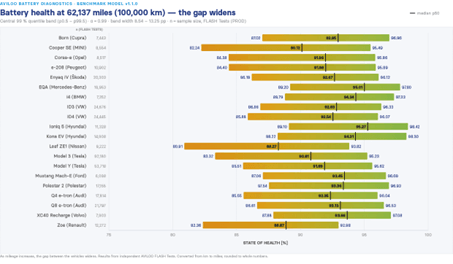
At 62,137 miles (100,000 km), the median ranges from 88.3 percent for the Leaf ZE1 to 95.3 percent for the Ioniq 5. The spread within individual models grows to as much as 13.3 percentage points.
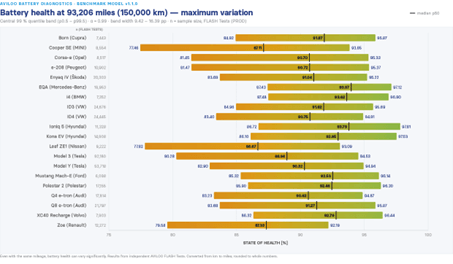
At 93,206 miles (150,000 km), the median ranges from 86.7 percent for the Leaf ZE1 to 94.0 percent for the Mercedes-Benz EQA. Within individual models, the spread reaches up to 16.4 percentage points, well above the maximum of 10.0 percentage points at 31,069 miles (50,000 km).
Four vehicles, four battery stories
Four example models show how this spread develops as mileage increases across all three milestones, from 31,069 to 93,206 miles (50,000 to 150,000 km), tracking both SoH and the resulting real-world range:
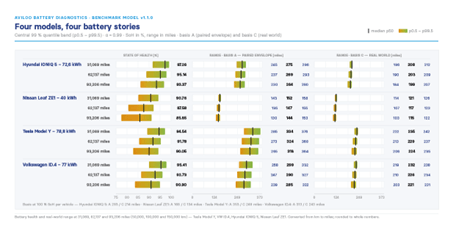
Tesla Model Y: the world's best-selling car for three years running, including internal-combustion cars: median SoH of 94.5 percent at 31,069 miles, 91.8 percent at 62,137 and 90.0 percent at 93,206 miles. Real-world range falls from 235 to 224 miles (379 to 361 km). Even so, at 93,206 miles there is a 29-mile (46 km) difference between the best and the weakest example, which means one extra charging stop on a long journey.
VW ID.4: one of Europe's best-selling electric cars in 2025: median SoH of 95.4 percent at 31,069 miles, 92.7 percent at 62,137 and 90.9 percent at 93,206 miles. Real-world range falls from 232 to 221 miles (373 to 355 km), with up to 28 miles (44 km) between the best and the weakest vehicle at 93,206 miles.
Hyundai Ioniq 5: median SoH of 97.3 percent at 31,069 miles, 95.1 percent at 62,137 and 93.4 percent at 93,206 miles, giving it consistently the highest SoH of the four models. Real-world range falls from 208 to 199 miles (335 to 321 km), while the spread grows to 23 miles (37 km) between the extremes.
Nissan Leaf ZE1: With 40 kWh, it has the smallest battery of the four models and the highest number of charging cycles, giving it consistently the lowest median SoH: 90.8 percent at 31,069 miles, 87.6 percent at 62,137 and 85.9 percent at 93,206 miles. Its real-world range drops from 121 to 115 miles (195 to 185 km), and the SoH spread is widest here at up to 13.7 percentage points, which, given the small battery, equals around 19 miles (30 km) between the best and the weakest vehicle at 93,206 miles.
“The truth in this data is that averages hide a lot. Yes, electric car batteries age better than the myth of rapid wear suggests, but that is not the most important finding. What matters is that battery health varies widely between models, and even more widely between individual vehicles of the same model. You cannot know where your own vehicle falls within that range without testing it independently.”
Dr. Marcus Berger, CEO of AVILOO
What this means for buyers, dealers and financiers
Even at 31,069 miles (50,000 km), the spread within individual models reaches up to ten SoH percentage points. Two cars with the same odometer reading can therefore be as far apart as a vehicle with a full tank and one with a quarter of a tank left, except you cannot tell just by looking at the battery. This difference continues to grow with mileage: on the Tesla Model Y, for example, it widens from 20 miles (32 km) of real-world range at 31,069 miles to 29 miles (46 km) at 93,206 miles.
This is exactly what a buyer, dealer or financier wants to know before a vehicle changes hands. A model average is not enough. Furthermore, battery health does not depend on mileage alone. Temperature affects ageing chemistry and charging speed, while cooler climates change charging behaviour and wear patterns compared to warmer regions. The AVILOO Certified EV Battery Report therefore tests globally, across North and South America, Europe, Australia and Asia, rather than reflecting the pattern of a single country.
Buyers of used internal-combustion cars rely on odometer readings and service records. The battery is the single most expensive component of an electric car, and the one with the widest variation from vehicle to vehicle. This is why the used-car market needs a dedicated, independent battery test like the AVILOO FLASH Test.
Order the AVILOO FLASH Test now.
For clarification, reach out to press@aviloo.com.

Stay up to date with the latest developments in e-mobility with our newsletter!
Would you like to change to USA related content?
You’re leaving AVILOO Inc. and heading to the AVILOO GmbH website. Click confirm to continue.
You’re entering the AVILOO Inc. website. Click confirm to continue.